Standardized Sampling with Gill Nets
This page describes two projects investigating bias in gillnet sampling.
Size Bias and Contact Selectivity Correction Factors for the North American Standard Gill Net
(Funded by the Oklahoma Department of Wildlife Conservation through Sportfish Restoration Grant F-50-R)
Project personnel: Ryan Ryswyk, Dan Shoup, Greg Summers, Chas Patterson, John Perry

Shoup, D.E. and Ryswyk, R.G.* 2016. Length selectivity and size-bias correction for the North American Standard Gill Net. North American Journal of Fisheries Management. 36:485-496
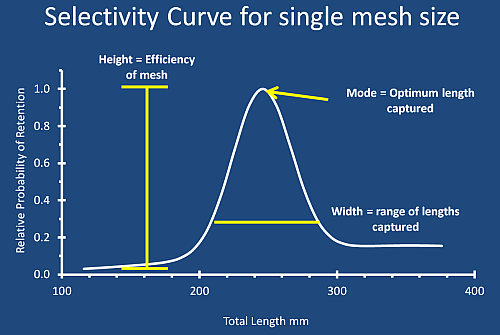
Gill nets are known to be size selective, but this bias can be corrected with the use of selectivity curves. By comparing the catch of each length class of each fish species across multiple mesh pannels, it is possible to quantify the length-specific probability of capture of each size of fish in each pannel (typically fit by least squares regression). This is known as the SELECT method for fitting a gill net selectivity curve (Share Each LEngth Catch Total; Millar and Holst 1997). The height of the curve corresponds to how efficiently that mesh catches fish of the optimum length. The width of the curve describes how fast the probability of capture declines for fish that are larger or smaller than the optimum length.
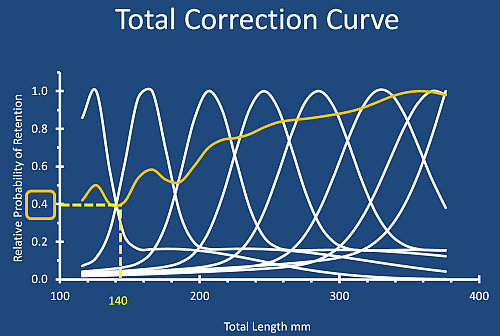
By combining the selectivity curves from each individual mesh panel, an overall selectivity curve can be developed for the entire net that describe the probability of retention for each length class of a species. The selectivity values (Sl the probability of retention for length class l) can then be used to adjust the catch rate of the net for contact bias (the probability of a fish encountering the net but not getting caught). To do this, the catch from the entire net should be quantified as the number of fish caught in each length class (10-mm groupings for our selectivity curves). For each length class, you then divide the number of fish captured by the Sl value for that length class. In cases where there is a low selectivity value (i.e., low probability of retention), this will result in dividing the number of fish captured by a value much less than one, resulting in a large increase in the number of fish in that length class (to account for fish that encountered the net and should have been captured had the net been bias free). In cases where the selectivity value was high (i.e., close to 1.0, indicating most fish encountering the net were captured), the number of fish is divided by a value close to 1.0, resulting in only minor changes (appropriate because there was little bias for this fish length class).
We sampled eight reservoirs with the North American standard gill net to develop a large length-specific data set. we then used the SELECT method to find the best-fit selectivity model to adjust the gill net catch for contact selectivity. To determine the magnitude of these selectivity corrections, we compared adjusted and unadjusted length frequencies and size indices for channel catfish, white crappie, white bass, hybrid striped bass, saugeye, and walleye at each reservoir. The bimodal model was the best fit selectivity model for all species. When selectivity-adjusted length-frequency data were compared with the original data, one third of hybrid striped bass length-frequencies and two thirds of white bass length-frequencies were significantly different. Roughly one third of PSDs showed meaningful changes after selectivity adjustments were made. By correcting for contact selectivity the data are always improved (even if only subtly), and at times the adjustments can be large enough to alter management decisions. Therefore, we suggest that selectivity adjustments should become a part of routine data analysis for the North American Standardized Gill Net design as they improve data for fisheries management.
If you would like to have our selectivity values to use to correct your North American Standard Net data, click here. Please keep in mind these values should only be applied to data collected from this same net design following the sampling protocol of Bonar et al. 2009. Selectivity data are available for channel catfish, hybrid striped bass, saugeye, walleye, white bass, and white crappie.
The effects of gill net design and random versus fixed sampling on CPUE, precision, and size structure, of pelagic fishes
(Funded by the Oklahoma Department of Wildlife Conservation through Sportfish Restoration Grant F-50-R)
Project personnel: Ryan Ryswyk, Dan Shoup, Greg Summers, Chas Patterson, John Perry
This research is published in Ryan Ryswyk's thesis (available here. Peer reviewed manuscript is still in review.
Standardized sampling procedures are important in fisheries management and are used to evaluate fish populations over time and between lakes in a region or state. In 1977 the Oklahoma Department of Wildlife Conservation (ODWC) developed “Standardized Sampling Procedures (SSP) for Lake and Reservoir Management Recommendations". Since that time, Oklahoma’s Reservoir SSP have been revised to obtain more accurate population parameters as well as maximize efficiency. The ODWC recently adopted the North American Standard net configuration suggested by Bonar et al. (2009) consisting of 80-foot long by 6-foot deep (1/2 basis) nets of 10-foot panels with bar mesh sizes of 1 ½, 2 ¼, 1, 1 ¾, ¾, 2 ½, 1 ¼, and 2 inches (respectively). Oklahoma’s previous gill net specifications were 200-foot long by 6-foot deep nets of 25-foot panels with bar mesh sizes of ½, 5/8, ¾, 1, 1 ½, 2, 2 ½, and 3 inches. Because biologist use gill nets to look at trends in fish populations over time, it would be beneficial to compare the catch rates and length frequencies of these two net designs in the same sampling season in order to understand the data interpretation consequences of changing net configurations. The ODWC’s current SSP protocol also requires sample locations to be fixed sites selected by the biologist. Fixed sites chosen in this manner are useful for monitoring changes in the population over time but may be more biased than random sites with respect to abundance and length frequencies. These sites may not be representative of the entire fish population and characteristics of these sites may change at a disproportional rate to the rest of the lake. Random sampling may give a more accurate assessment of sportfish populations and allow biologists to make more reliable comparisons between lakes in Oklahoma.
There were no significant differences in catch rates between the old and new net configuration for four of the six target species at fixed sites. The CPUE variability of the new nets at fixed sites was lower or similar to the old nets, except for hybrid striped bass, which had higher variability in the new nets. Length-frequency distributions differed between the two net types for most species at fixed sites; however, after accounting for the fish caught in the smallest meshes of the old net, only channel catfish and some hybrids striped bass length distributions differed. White bass was the only species to show a significant difference in CPUE between fixed and random sites. CPUE variability was slightly higher at random sites for only white bass. Length frequencies were mostly unaffected by fixed or random sampling. I recommend ODWC include random gill net sites in their SSP because the variability of CPUE from random and fixed sites is only slightly different, but random sites are expected to provide a better representation of the true population.